Morphing Distributions Over Time
I was recently assisting with a project. We wanted to draw how a distribution changes over time. Unfortunately, the “obvious” answer doesn’t work. Let’s assume these are normal distributions. Here are our 4 sets of distribution parameters.
[
    { "mean": 10, "sd": 2 },
    { "mean": 40, "sd": 4 },
    { "mean": 40, "sd": 5 },
    { "mean": 40, "sd": 6 }
]
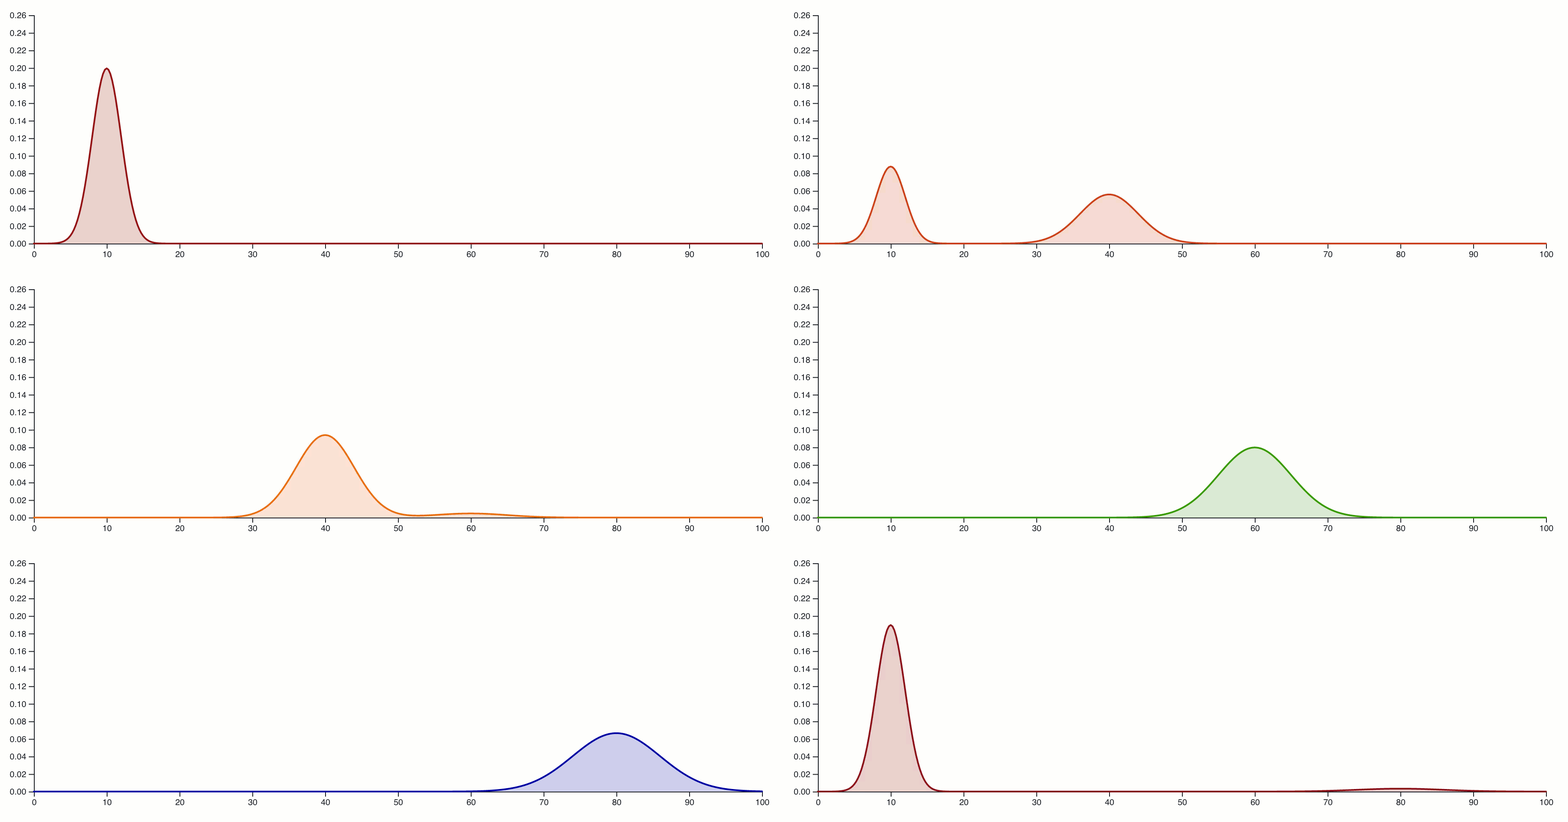
At first, we created a data set with all 4 sets of data points, then we transitioned the path’s d property using the default transition and attr functions. We ended up with a graph that looks like this. Unfortunately, we end up with an animation like the following.

Why does this happen? Because the default tweening function for a path updates each (x, y) pair independently. Consider the following example.
var startingPath = [
    { x: 1, y: 10 },
    { x: 2, y: 15 },
    { x: 3, y: 0 },
    { x: 4, y: 0 },
    { x: 5, y: 0 }
];

var endingPath = [
    { x: 1, y: 2 },
    { x: 2, y: 0 },
    { x: 3, y: 3 },
    { x: 4, y: 18 },
    { x: 5, y: 2 }
];
Each (x, y) pair transitions on its own. (1, 10) → (1, 2); (2, 15) → (2, 0); etc.
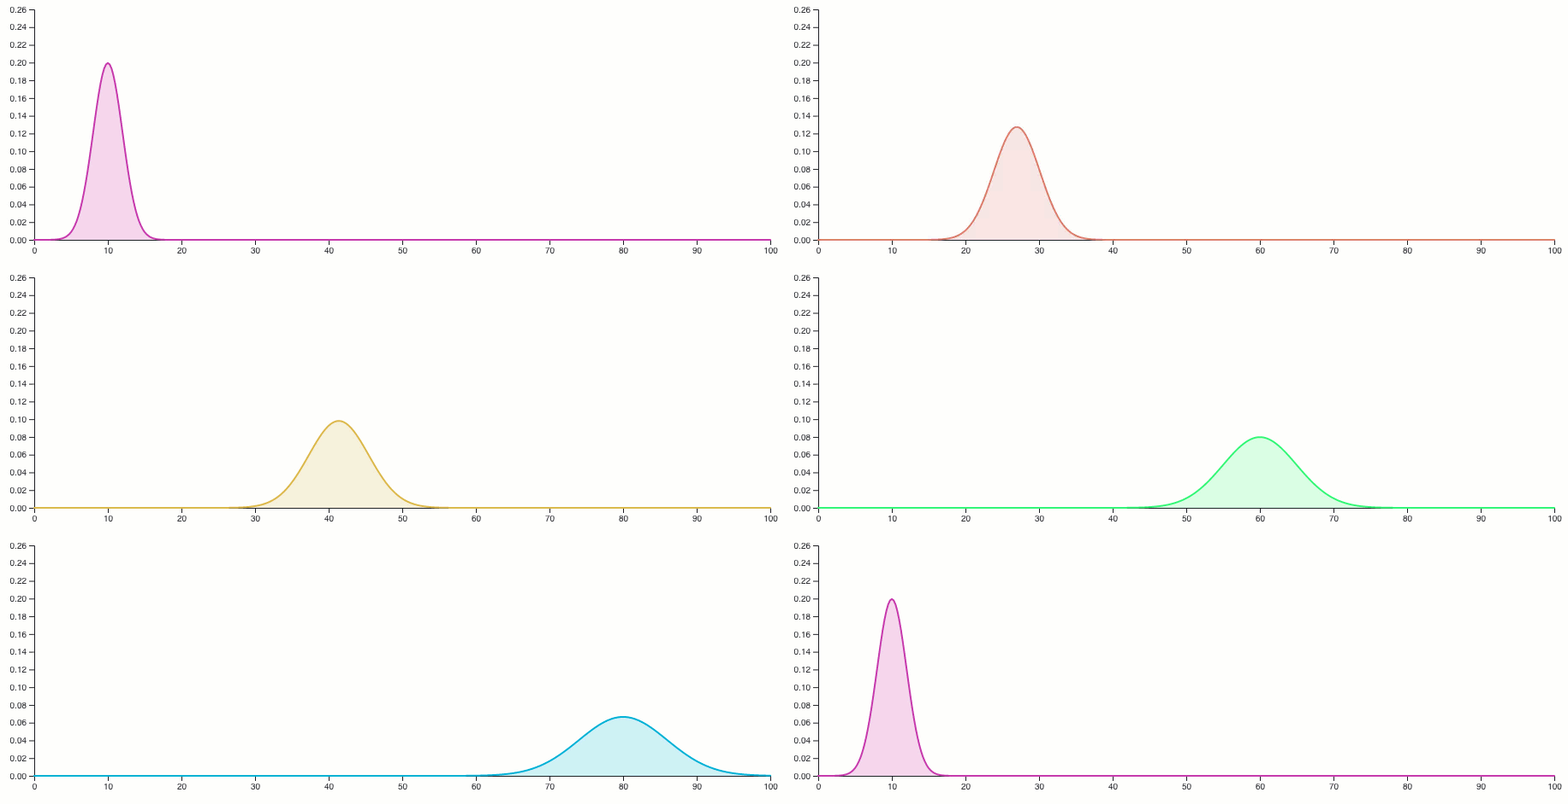
This is clearly not what we are looking for. Instead, we want to have a single line and mutate the individual points ourselves. We accomplish this by creating a custom function to use with D3’s attrTween.
function tweenPath(data, fromIndex, toIndex, t, isClosed) {
    const m = dists[fromIndex].m + t * (dists[toIndex].m - dists[fromIndex].m);
    const sd = dists[fromIndex].sd + t * (dists[toIndex].sd - dists[fromIndex].sd);
    data.forEach((datum, i) => {
        data[i] = createDatum(i, { m, sd });
    });
    const closer = isClosed ? " Z" : "";
    return `${line(data)}${closer}`;
}

path.transition()
    .delay(delay)
    .duration(duration)
    .ease(ease)
    .attrTween("d", () => {
        return t => {
            return tweenPath(data, index1, index2, t, false);
        };
    })
    .attr("stroke", dists[index2].color)
    .on("end", () => {
        loop();
    });

This code is running on ObservableHQ.
